

挑戦への投資で、
成長への循環をつくりだす
Fueling perpetual growth;
investing in bold visions
( Scroll to Explore )
Track Record
-
累計投資社数
4,246
-
累計IPO社数
1,041
-
累計ファンド運用総額
1.2 兆円
私たちは、1973年の設立以来、起業家をはじめとした多様な挑戦とともに歩み続けてきました。
当社の歩みと、皆さんと共に実現したい未来についてご紹介します。
What’s JAFCO?
Our Investments
JAFCOの投資について
「新事業の創造」と「第二創業の実現」
産業の新陳代謝に向けた
2つの投資事業領域

Venture
Investment
ベンチャー投資
大胆な投資と集中的な経営関与で、
未来を拓くスタートアップの
継続的な事業成長を推進
Buyout
Investment
バイアウト投資
成長を軸とした投資スタイルで、
新たなステージに挑戦する
企業の持続的な価値向上を実現

& JAFCO
POST
これからの時代を切り開く「挑戦する人」を応援する
インタビュー・トレンド発信メディア
-
投資先支援のリアル
プロ経営者は、なぜコーチングを求めたのか ウォーターフロント・𠮷野社長が挑んだ組織改革 2年3カ月間の「問い」の伴走
2026.03.06
.png)
-
リサーチ
AIラッパーに価値はないのか?~生成AI時代の持続的競争優位の構築戦略~(ジャフコ投資仮説レポート 第4号)
#AI
2026.03.04
-
投資先インタビュー
婚活市場を牽引するオミカレの新たなスタート。自治体や企業と共に、「トキメキ」を伴う出会いの場を創造する
2026.02.26
-
リサーチ
海外事例から考察する、日本流AIビジネス~顧客起点で再考する Post PoC時代の仮説~(ジャフコ投資仮説レポート 第3号)
#AI
2026.01.27
-
投資先インタビュー
日本の店舗が世界で勝つために店舗経営を支えるインフラを創るーカンリーの挑戦と歴史ー
#スタートアップの壁
2025.12.18
-
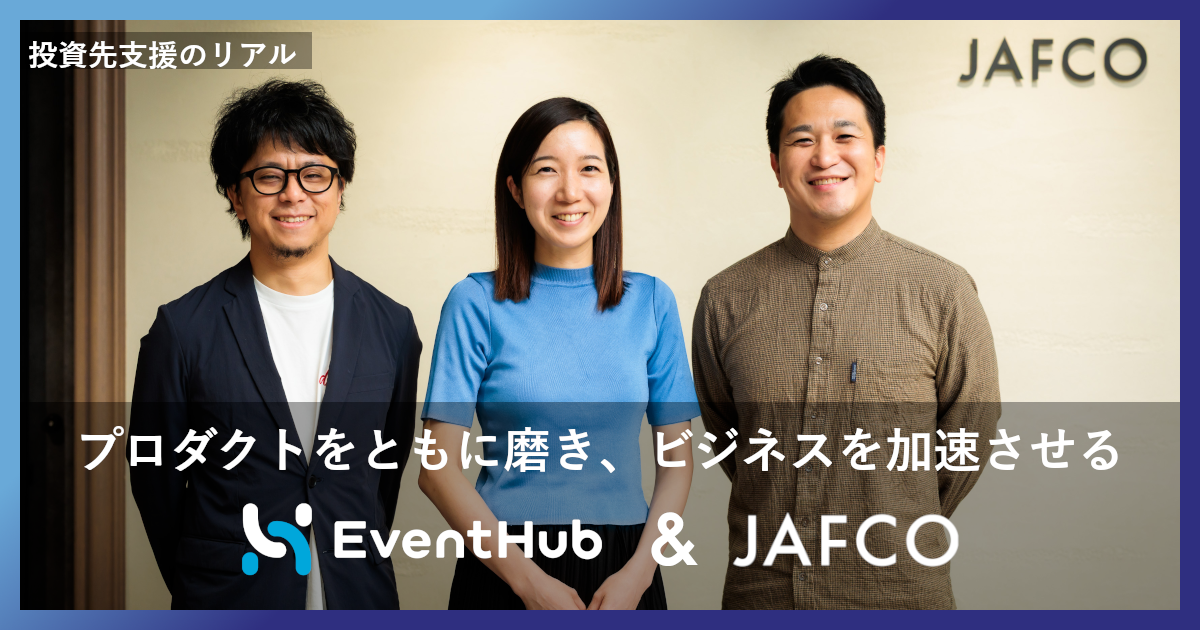
投資先支援のリアル
プロダクトをともに磨き、ビジネスを加速させる。 JAFCOがユーザー視点で支えるEventHubの挑戦
2025.12.10
すべての記事を見る